Analytics and Reporting
Numbers turned into dashboards and reports people actually read. Cut manual reporting time by 60% and covered campaigns past a billion impressions.
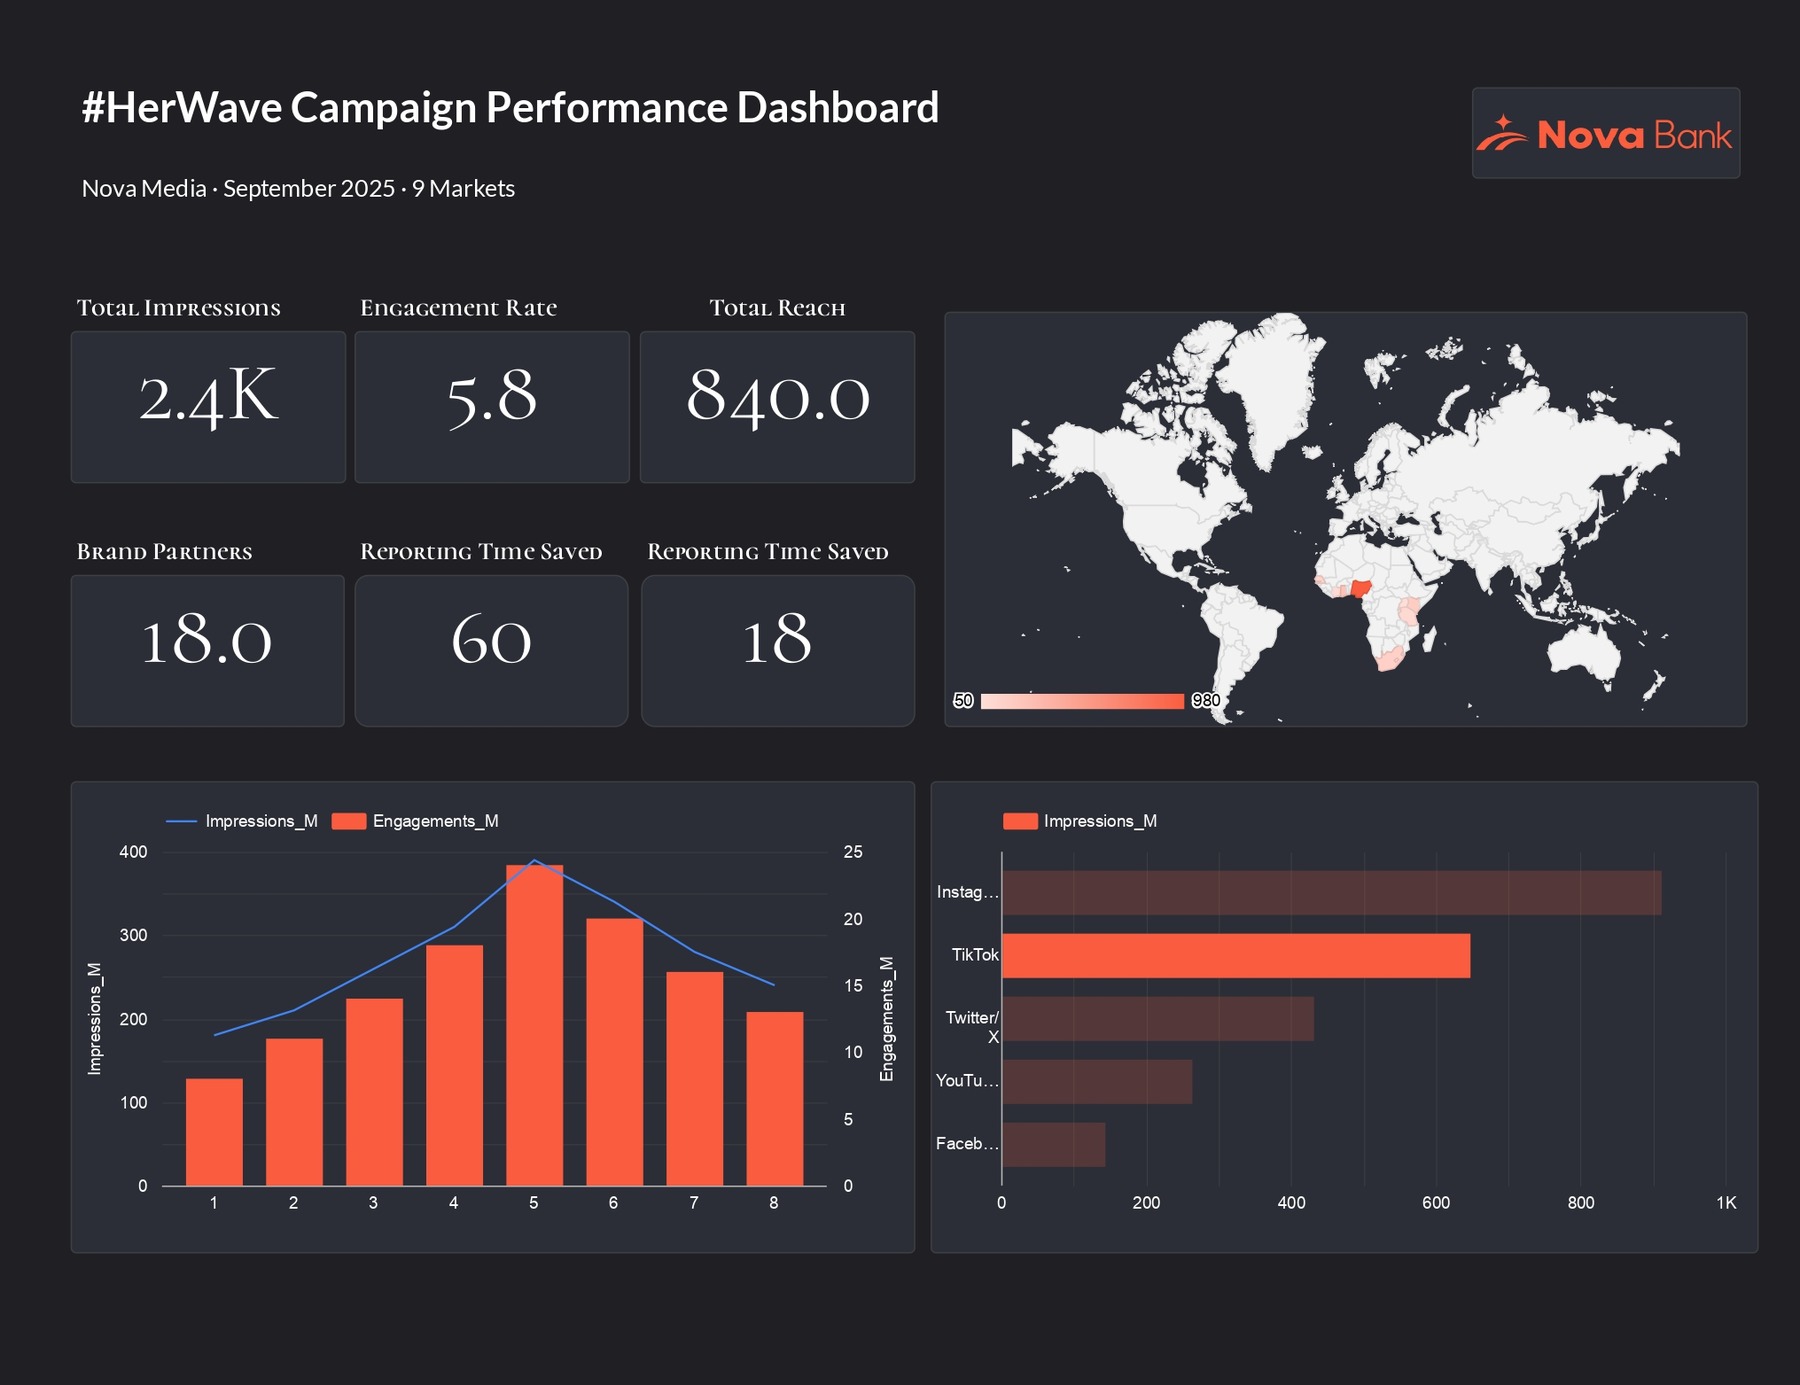 Campaign Dashboard
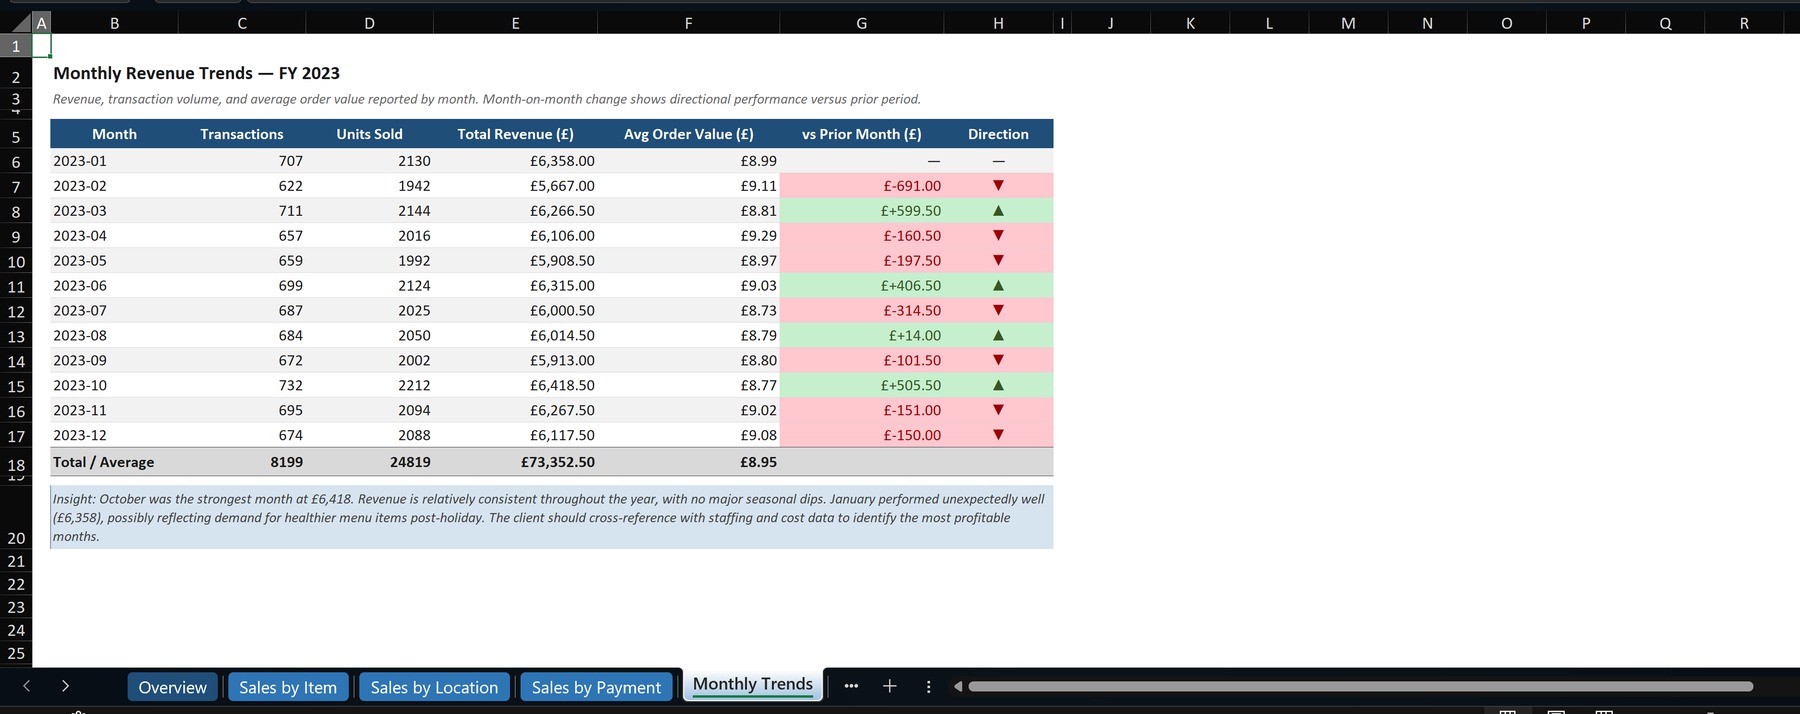 Monthly Trends Report
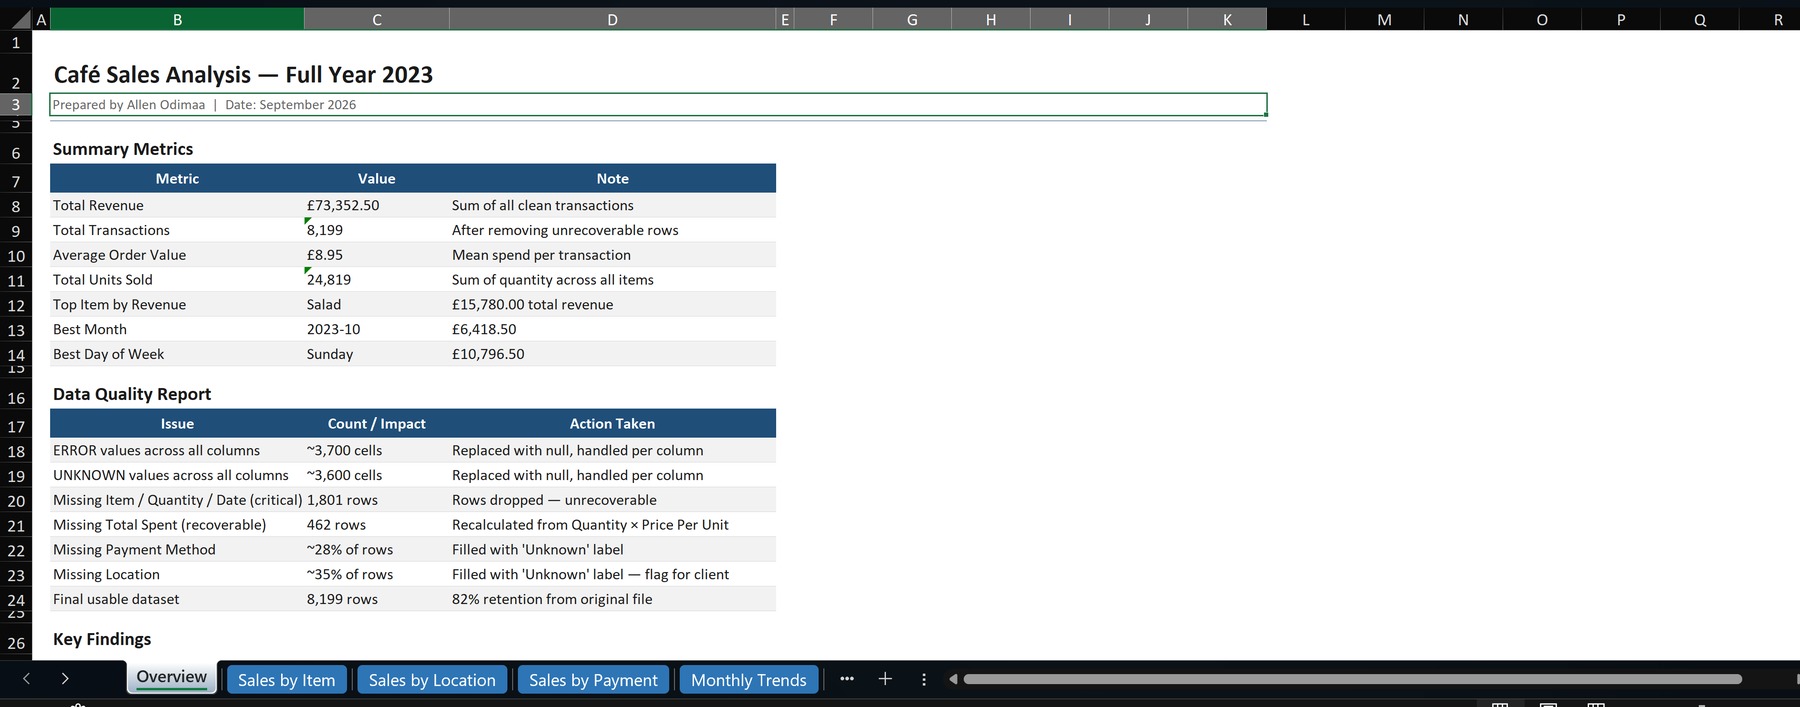 Sales Analysis Report
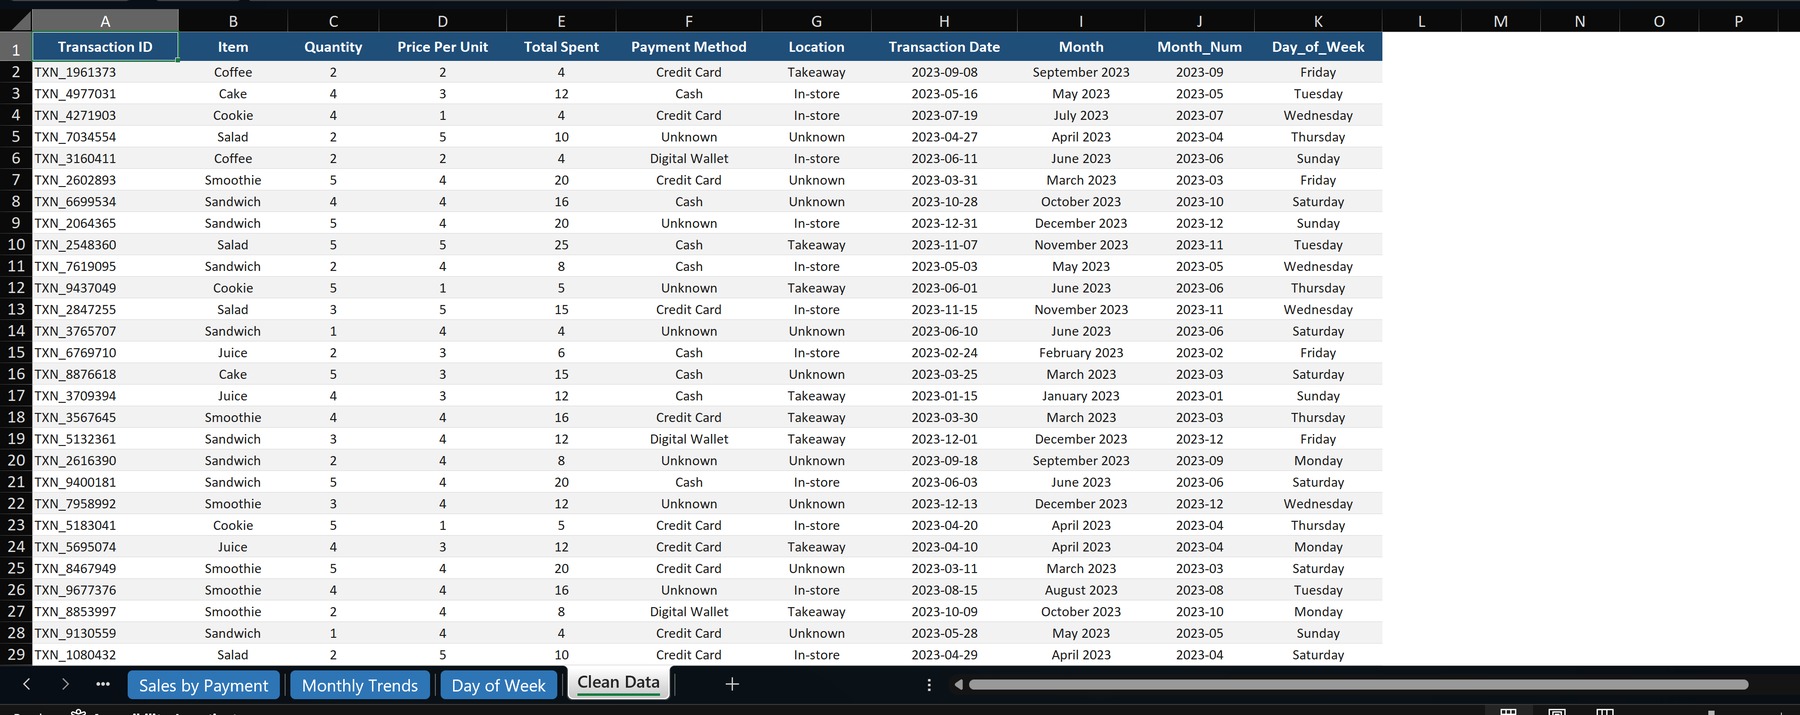
From messy exports to something you can actually read
Most raw data isn't ready for a client, or for a decision. Errors, blanks, inconsistent labels. This is the same dataset, before I touch it and after.
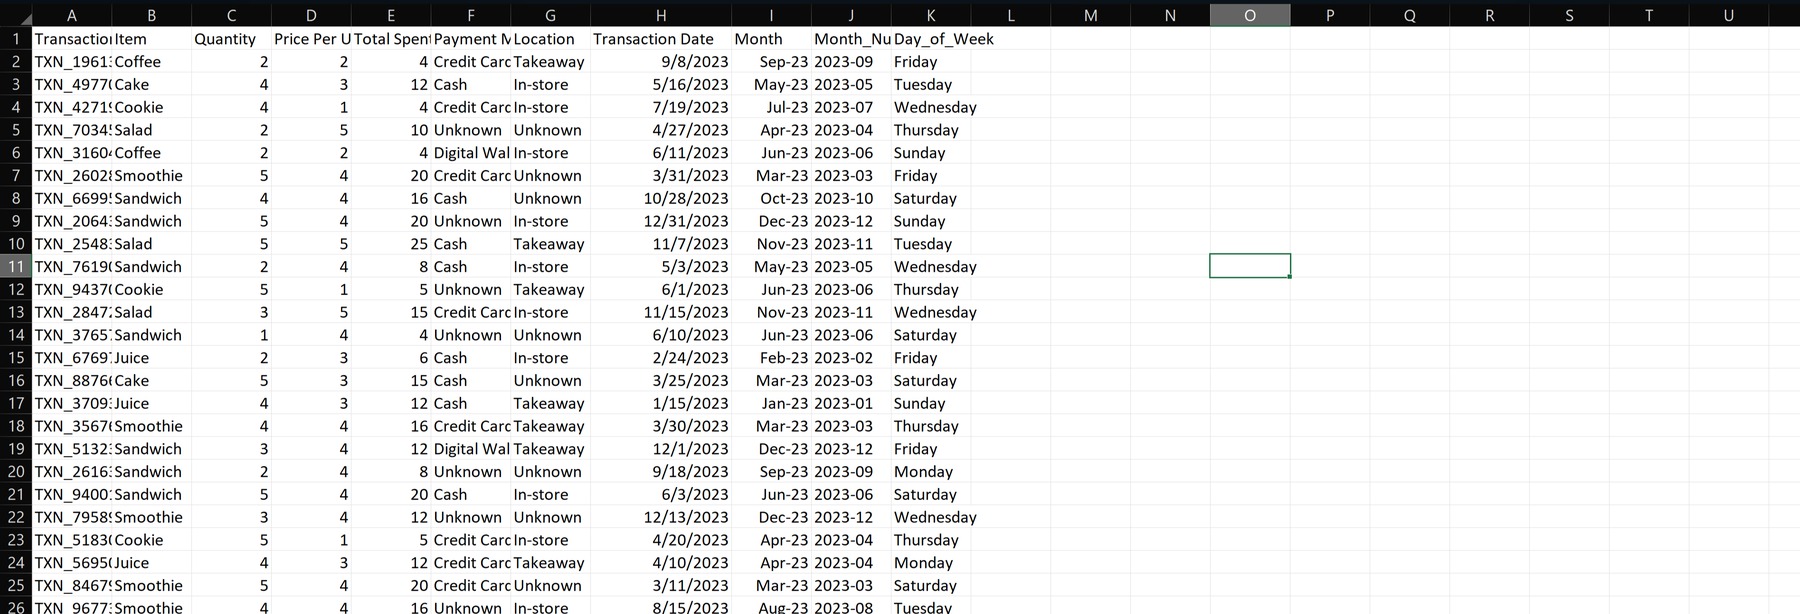
One pipeline, several outputs
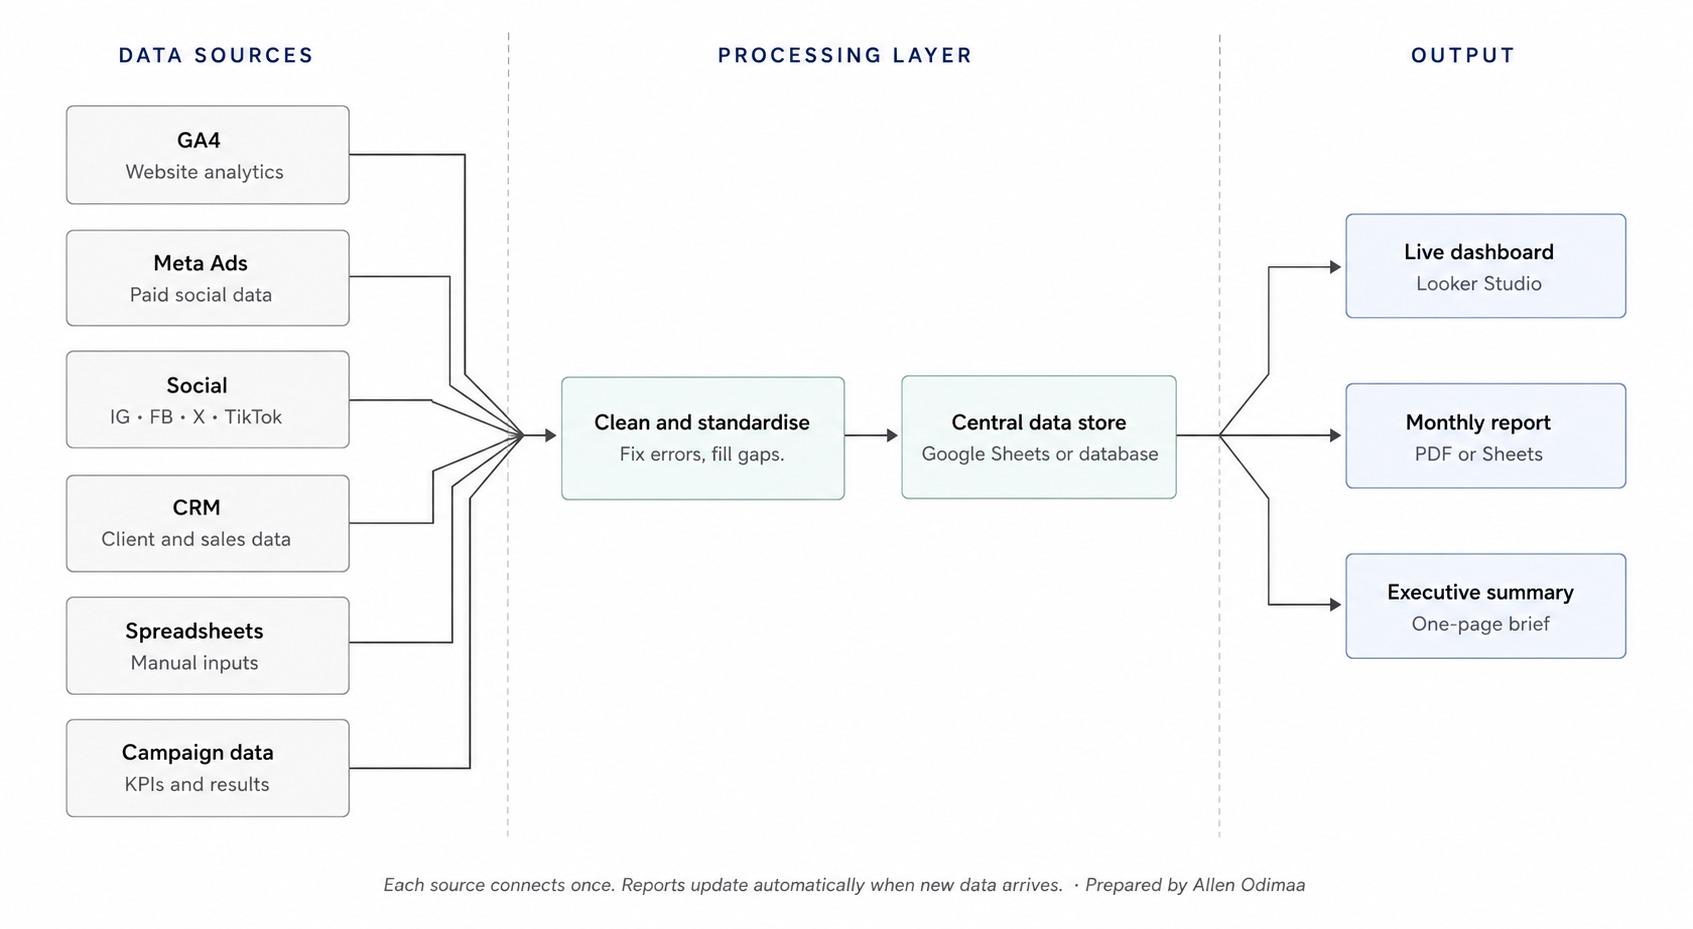
Every source connects once. From there, the same clean data feeds a live dashboard, a monthly report, and a one-page summary, automatically.
What I take off your plate
Connecting the platforms and spreadsheets so nobody's copying numbers by hand between tabs.
Fixing errors, filling gaps, making sure the same metric means the same thing everywhere it shows up.
Live dashboards built around what actually needs watching, not a generic template with your logo on it.
Monthly and campaign-level reports written so a client can act on them, not just skim past them.
Checking the numbers before anyone else has to ask if they're right.
Fresh Build
You bring the data sources, I build the dashboard and reporting flow around them, from scratch.
Fix What's Broken
Already have a dashboard that's gone stale or stopped adding up? I get it working properly again.
Ongoing Reporting
Monthly or campaign-based reporting, handled on a schedule, so it's never a last-minute scramble.
Whatever your data already lives in


 Excel
Excel